There is no row limit on Databar tables. You can store and enrich as many rows as you need, with no caps or restrictions on table size.
Creating tables
You can create a new table in several ways:- Blank table
- CSV upload
- Data sources
- Webhooks
Click New table from your workspace home to start with an empty table. Add columns and rows manually, or attach enrichments to populate data automatically.
Columns
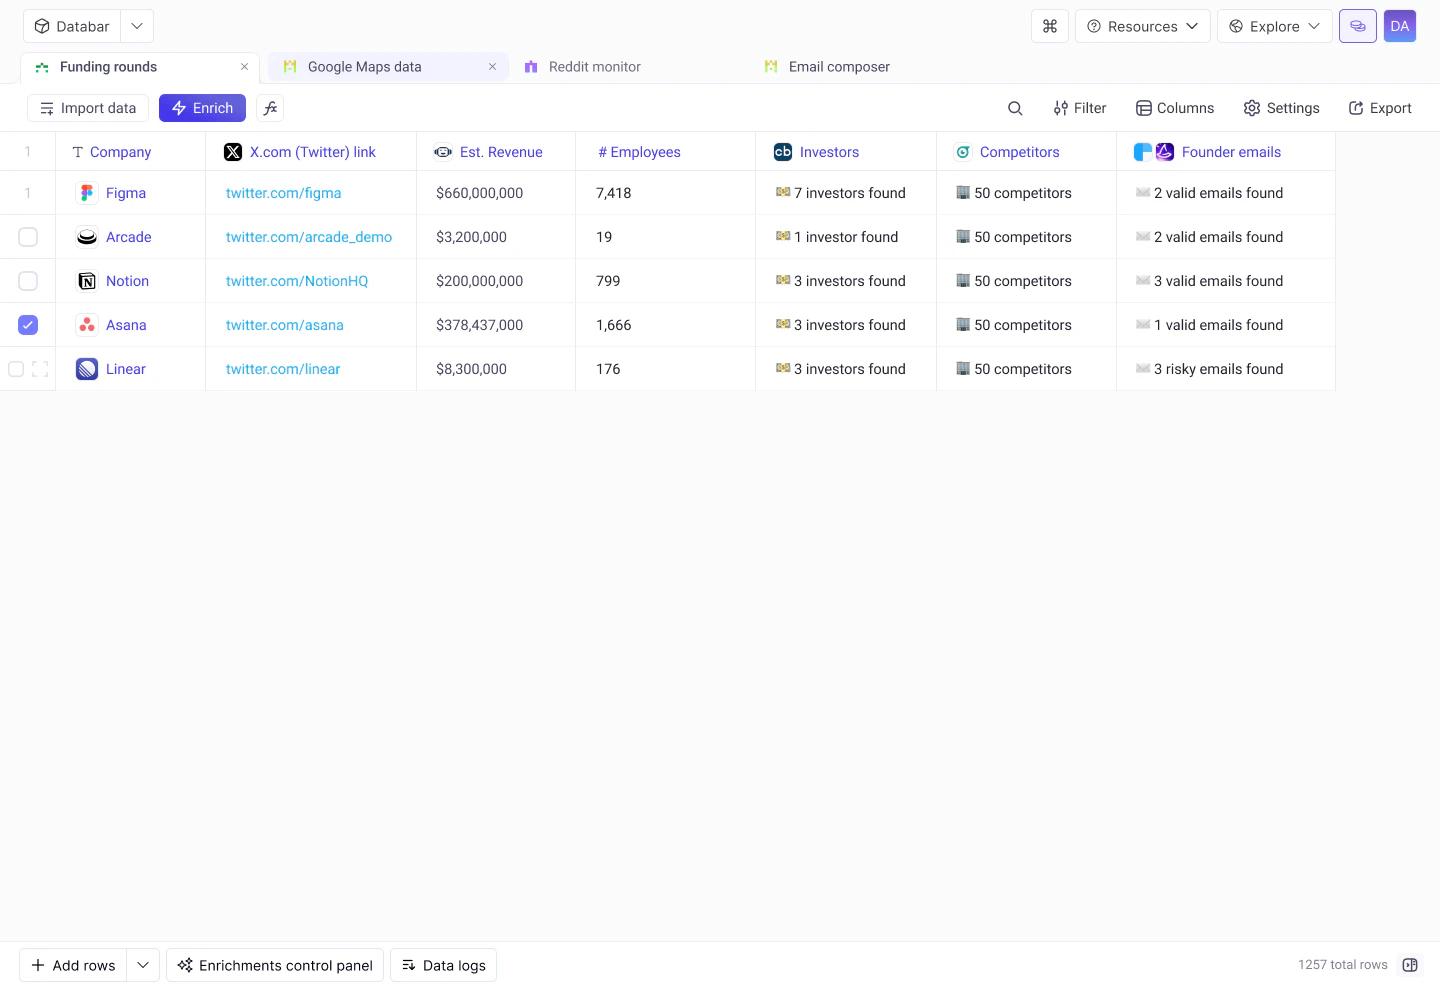
Add columns by clicking the + button at the end of the header row. Click any column header to rename, delete, change type, or sort. Enrichment columns are created automatically and grouped under collapsible headers. Databar supports 11 column types including Text, Number, Currency, Boolean/Checkbox, Date, Datetime, URL, Image, JSON, Select, and Multiple choice.Columns
Learn about column types, management, and grouping
Rows
Adding rows
- Single row: click Add row at the bottom of the table.
- Bulk add: paste multiple values or use an importer to add hundreds or thousands of rows at once.
- Programmatic: use the Tables API to insert rows from scripts or automations.
Editing cells
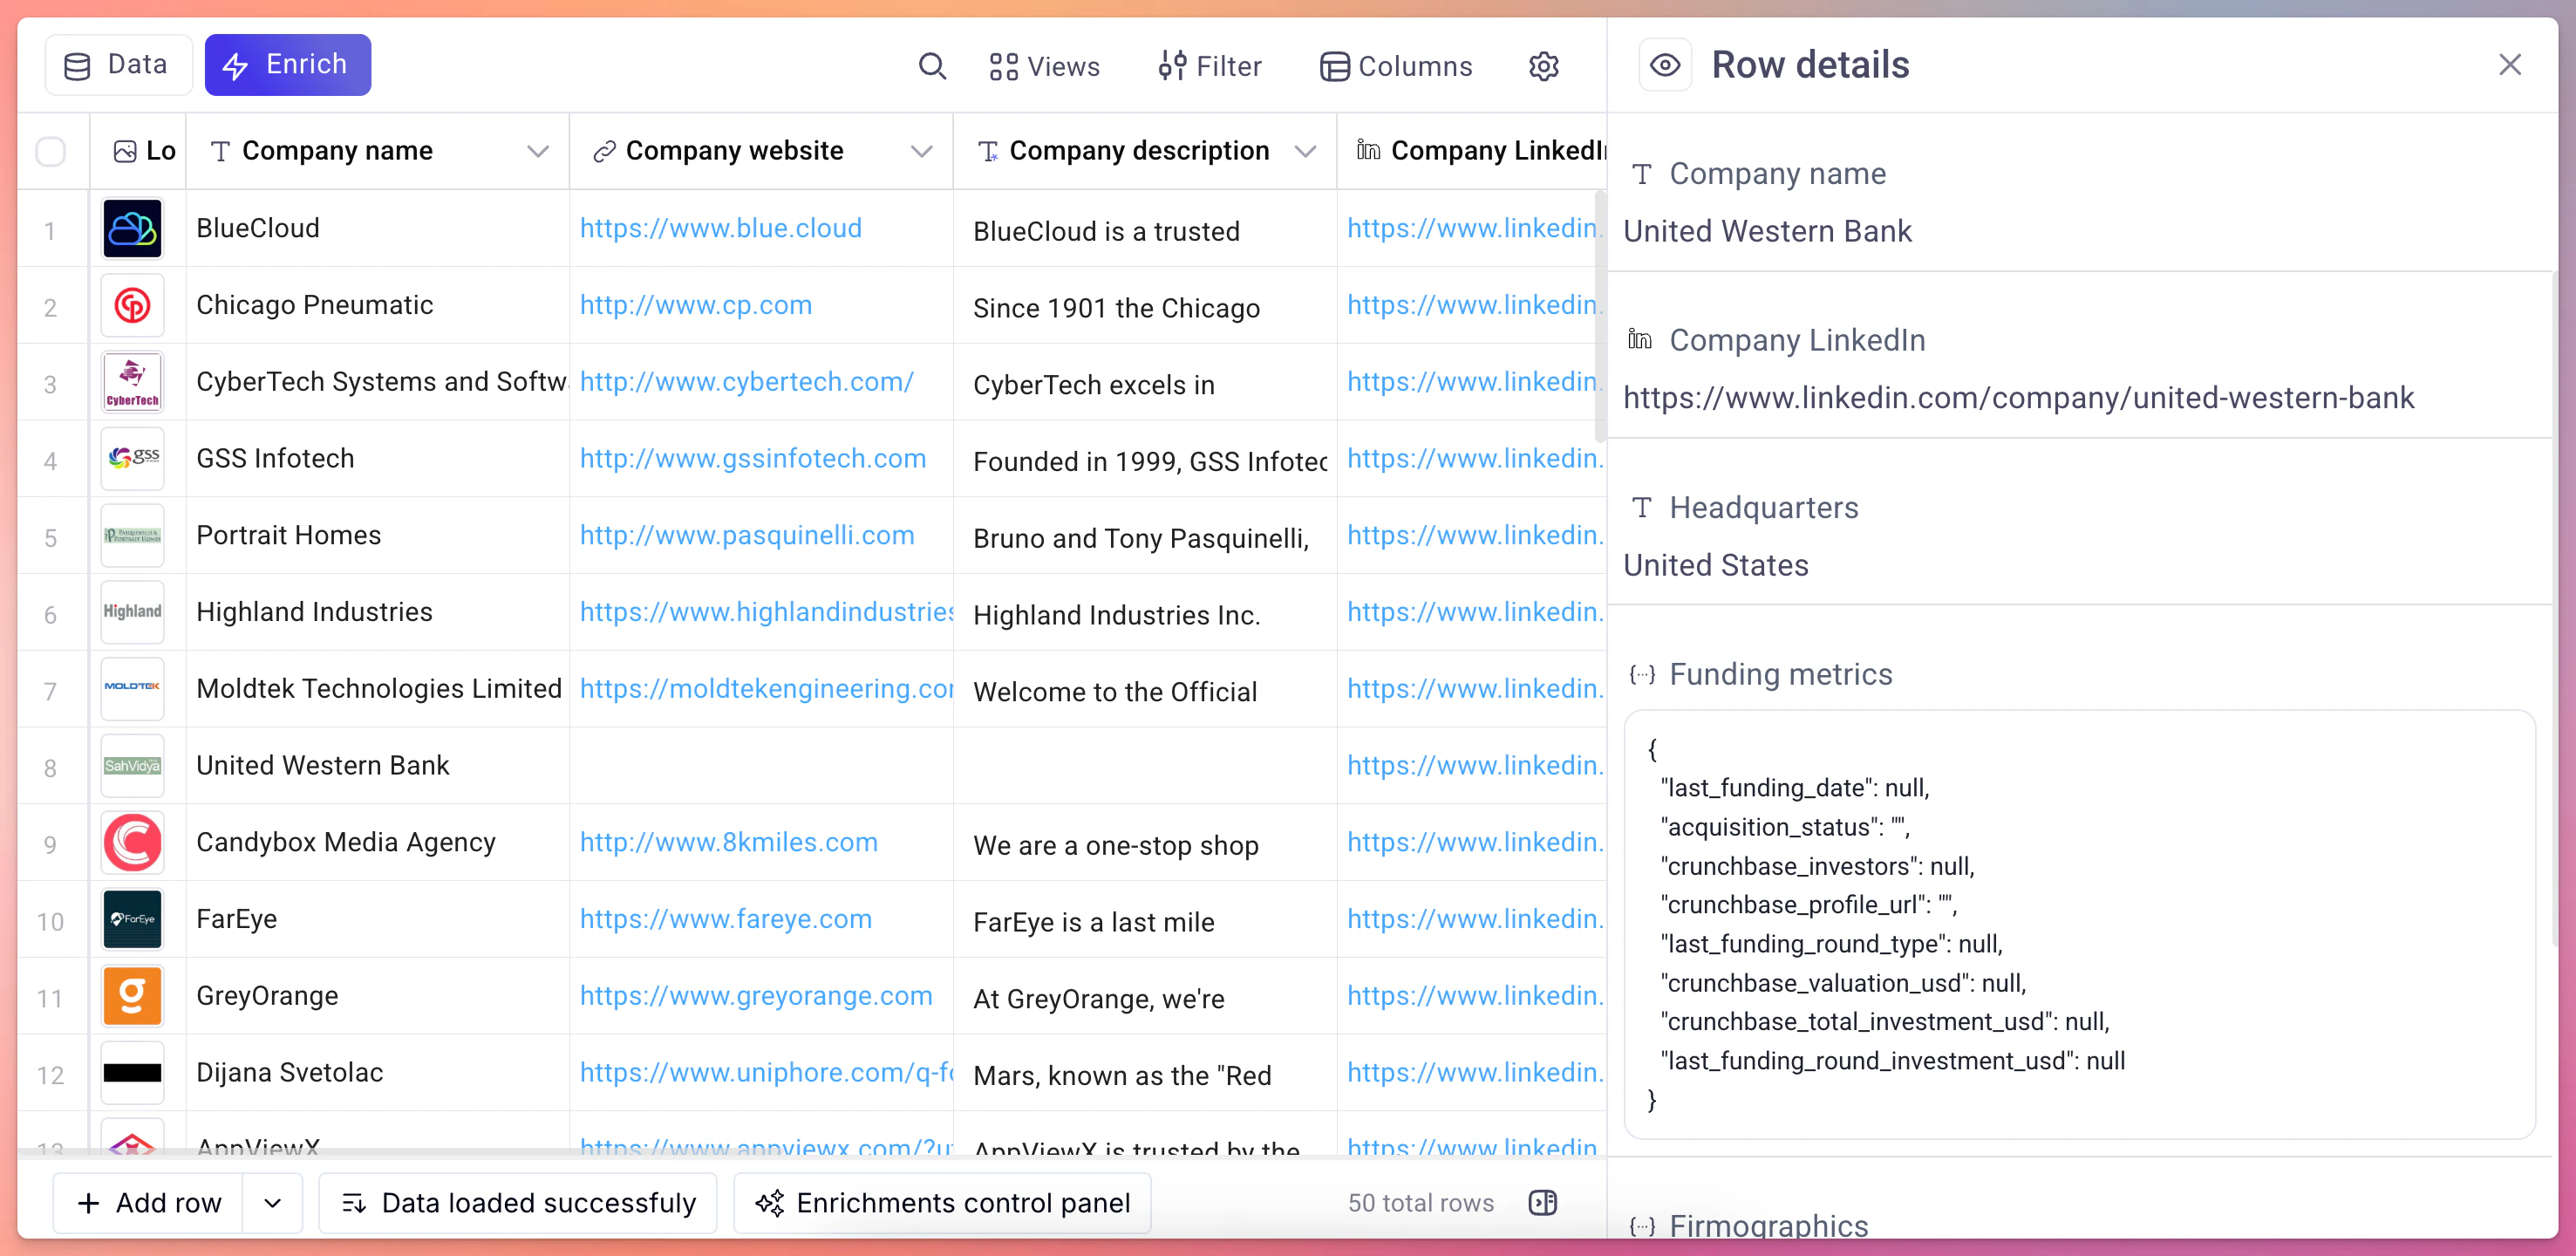
Click any cell to edit its value directly. For JSON columns, use the expanded editor for easier navigation of nested structures. You can also use the JSON Expander to flatten nested fields into their own columns.Row detail view
Click the expand icon on any row to open the sidebar detail view. This shows all column values for that row in a vertical layout, making it easier to inspect complex or wide tables.- How to access
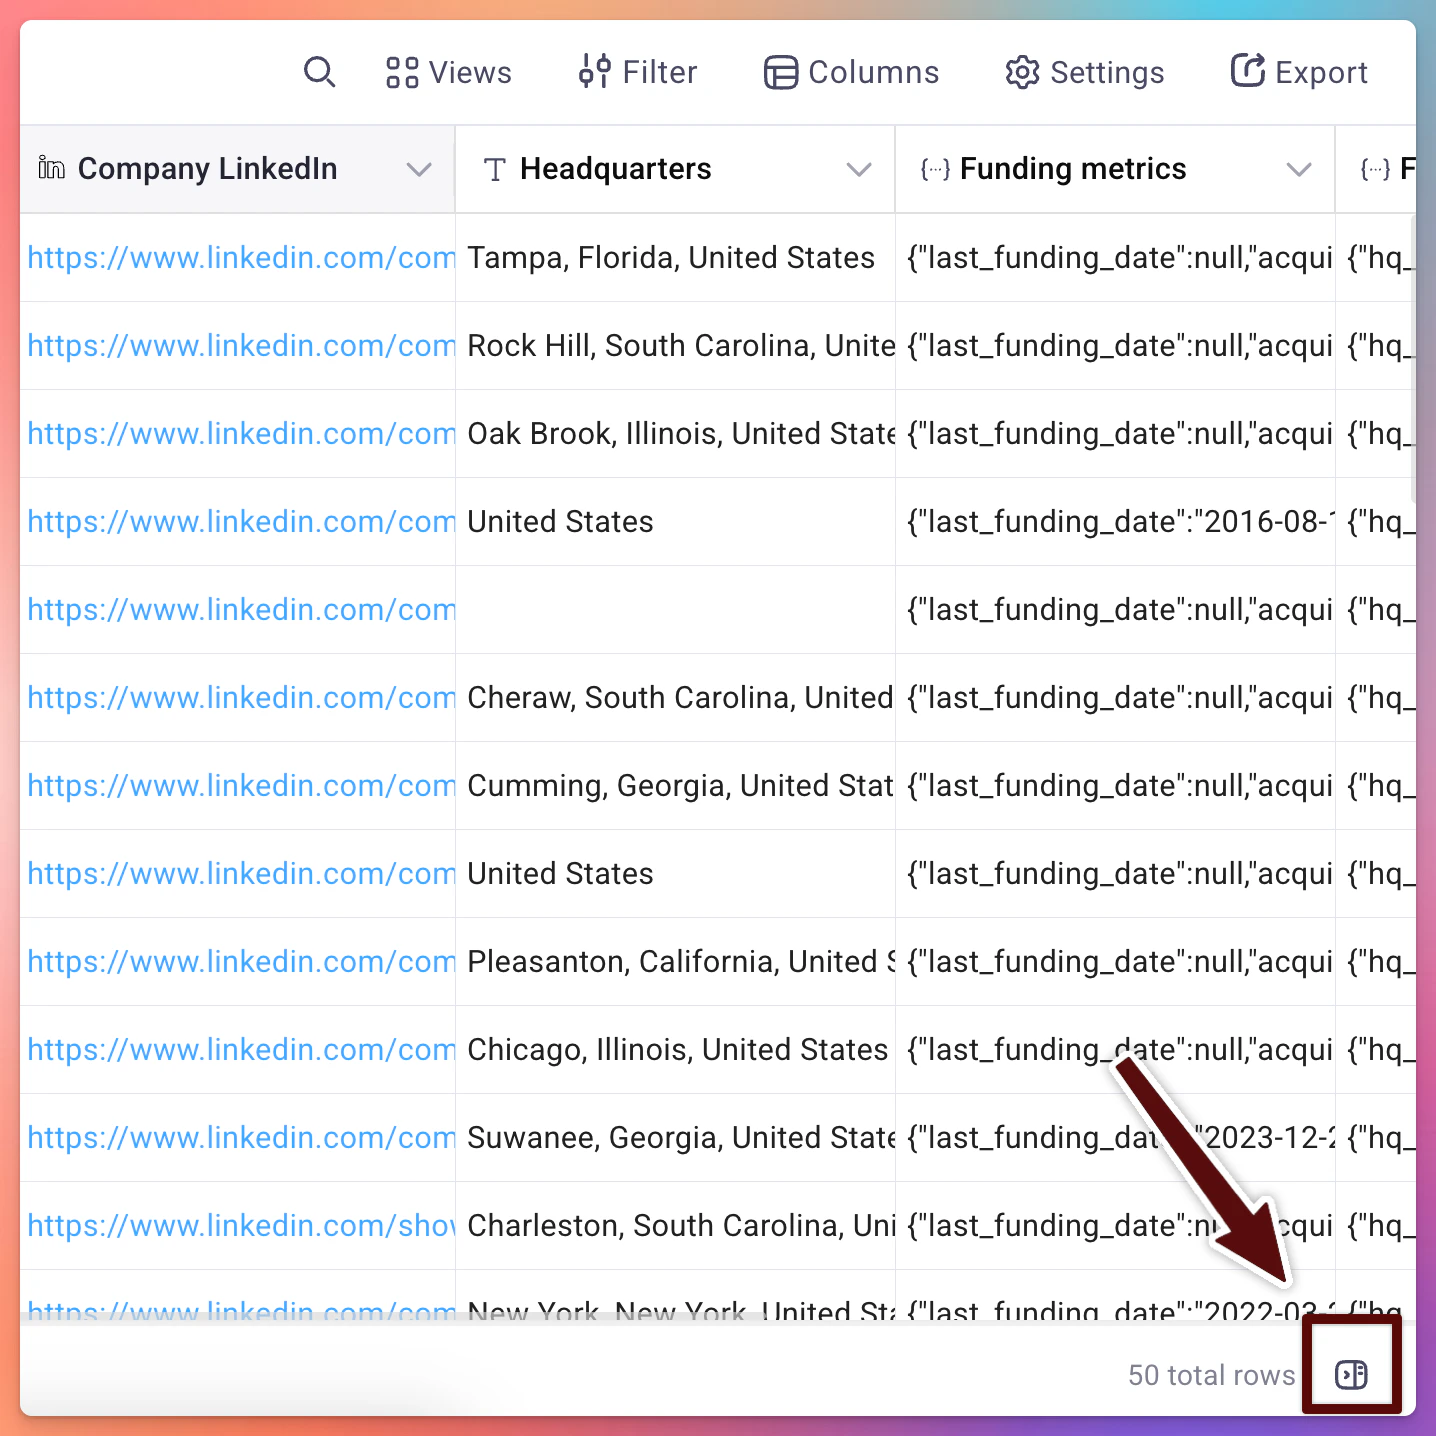
Infinite scroll
Tables load rows progressively as you scroll. There is no pagination. Just keep scrolling to see more data, even for tables with tens of thousands of rows.Cell-level enrichment statuses
Each cell populated by an enrichment displays a status indicator (success, no data, error, loading, run conditions not met, or inputs missing) so you can spot issues at a glance. Hover over any error icon to see the details inline.Debug requests
Full reference for all cell statuses, data logs, status codes, and troubleshooting steps
Filtering and sorting
- Sort: click any column header to sort ascending or descending.
- Filter: use the filter bar above the table to show only rows matching specific conditions (e.g., “Status equals Error” or “Email is not empty”).
Data formatting
Databar automatically handles common formatting needs:- UNIX timestamps are converted to human-readable dates.
- Booleans display as checkmarks or crosses.
- Image URLs render inline previews.
- Long text is truncated in the cell with full content visible in the detail view.
Working with JSON columns
Many API providers return nested JSON objects. Databar provides a JSON expander that lets you flatten specific fields from a JSON column into their own top-level columns. This makes it easy to extract exactly the data you need without manual parsing. See the JSON Expander page for details.Next steps
Enrichments
Attach data providers to your table columns
Import data
Bring data in from external sources
Debug requests
Troubleshoot enrichment errors
Tables API
Create and manage tables programmatically